
Learning susceptibility from what storms did
An early demo in West Palm Beach
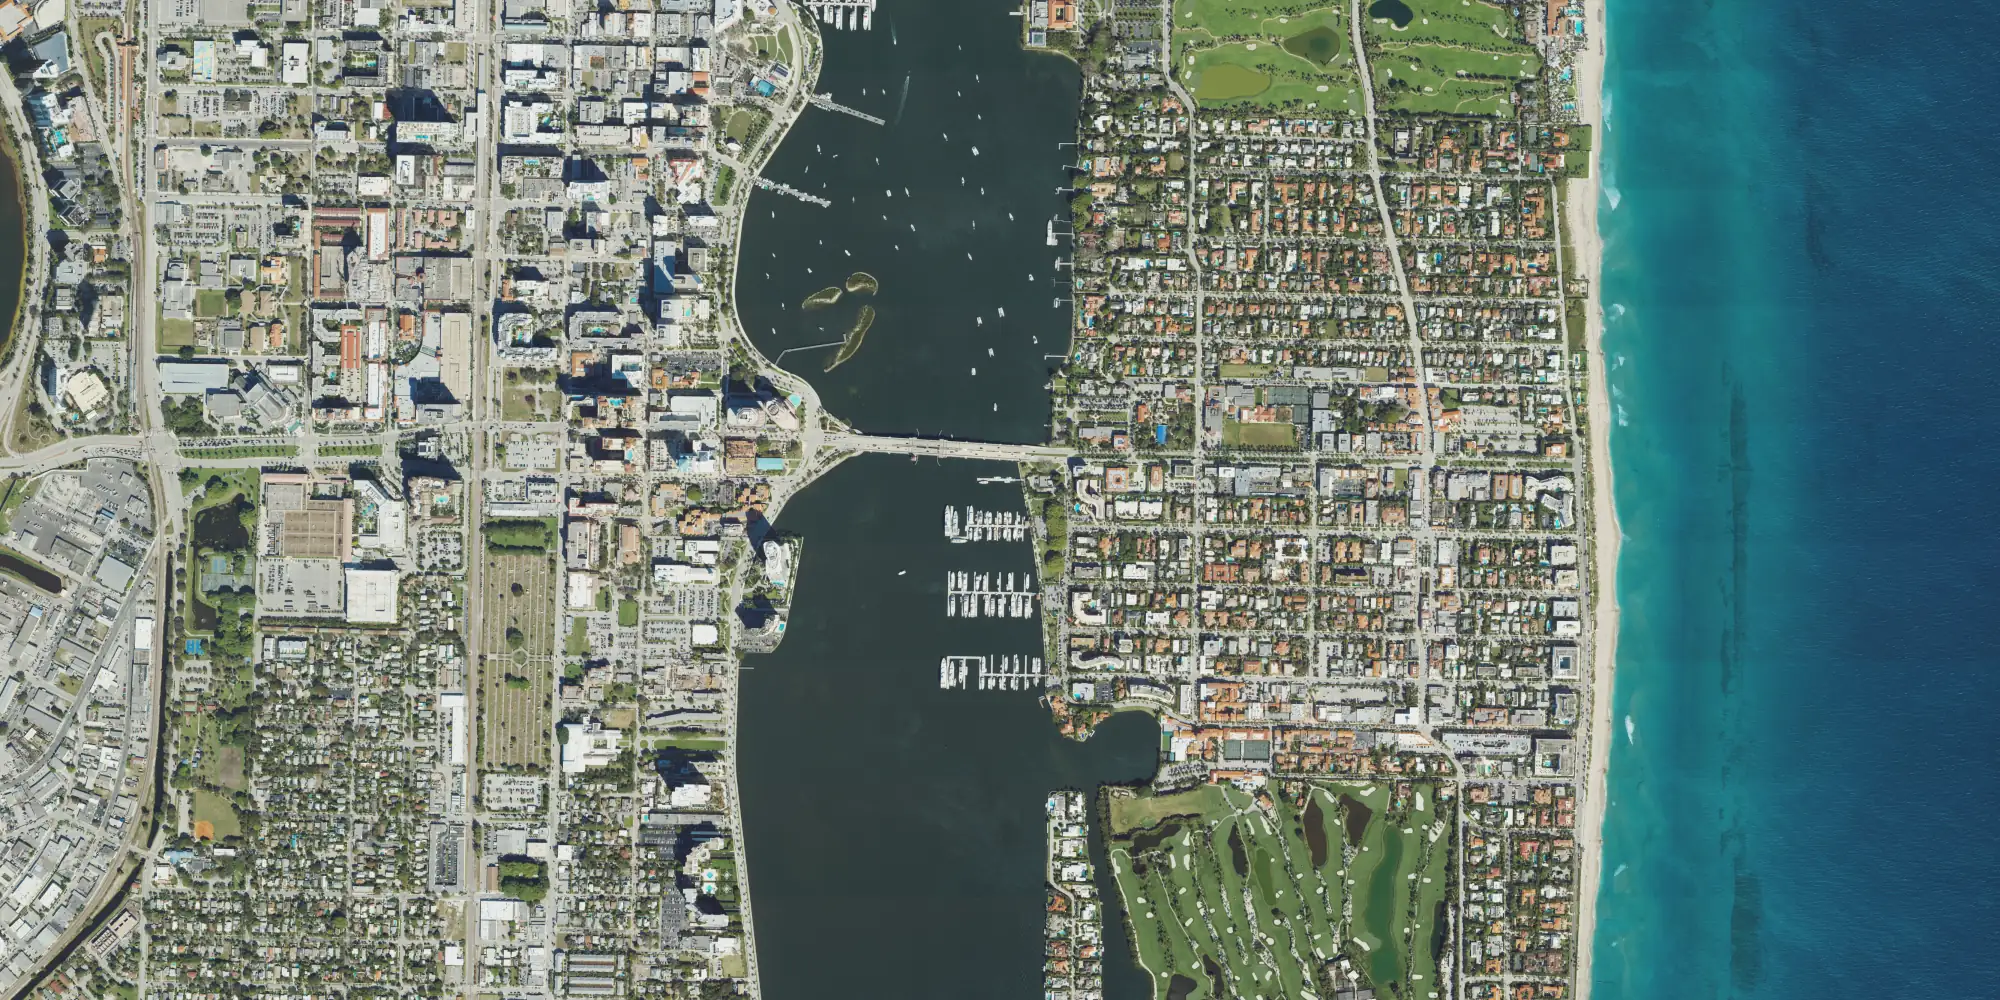
This is our multiplier on 2,332 structures in West Palm Beach. Our latest model combines physics with deep learning on aerial imagery. The values are early model output and are not for underwriting.
Tap or click the map 4 × 2 km · north up
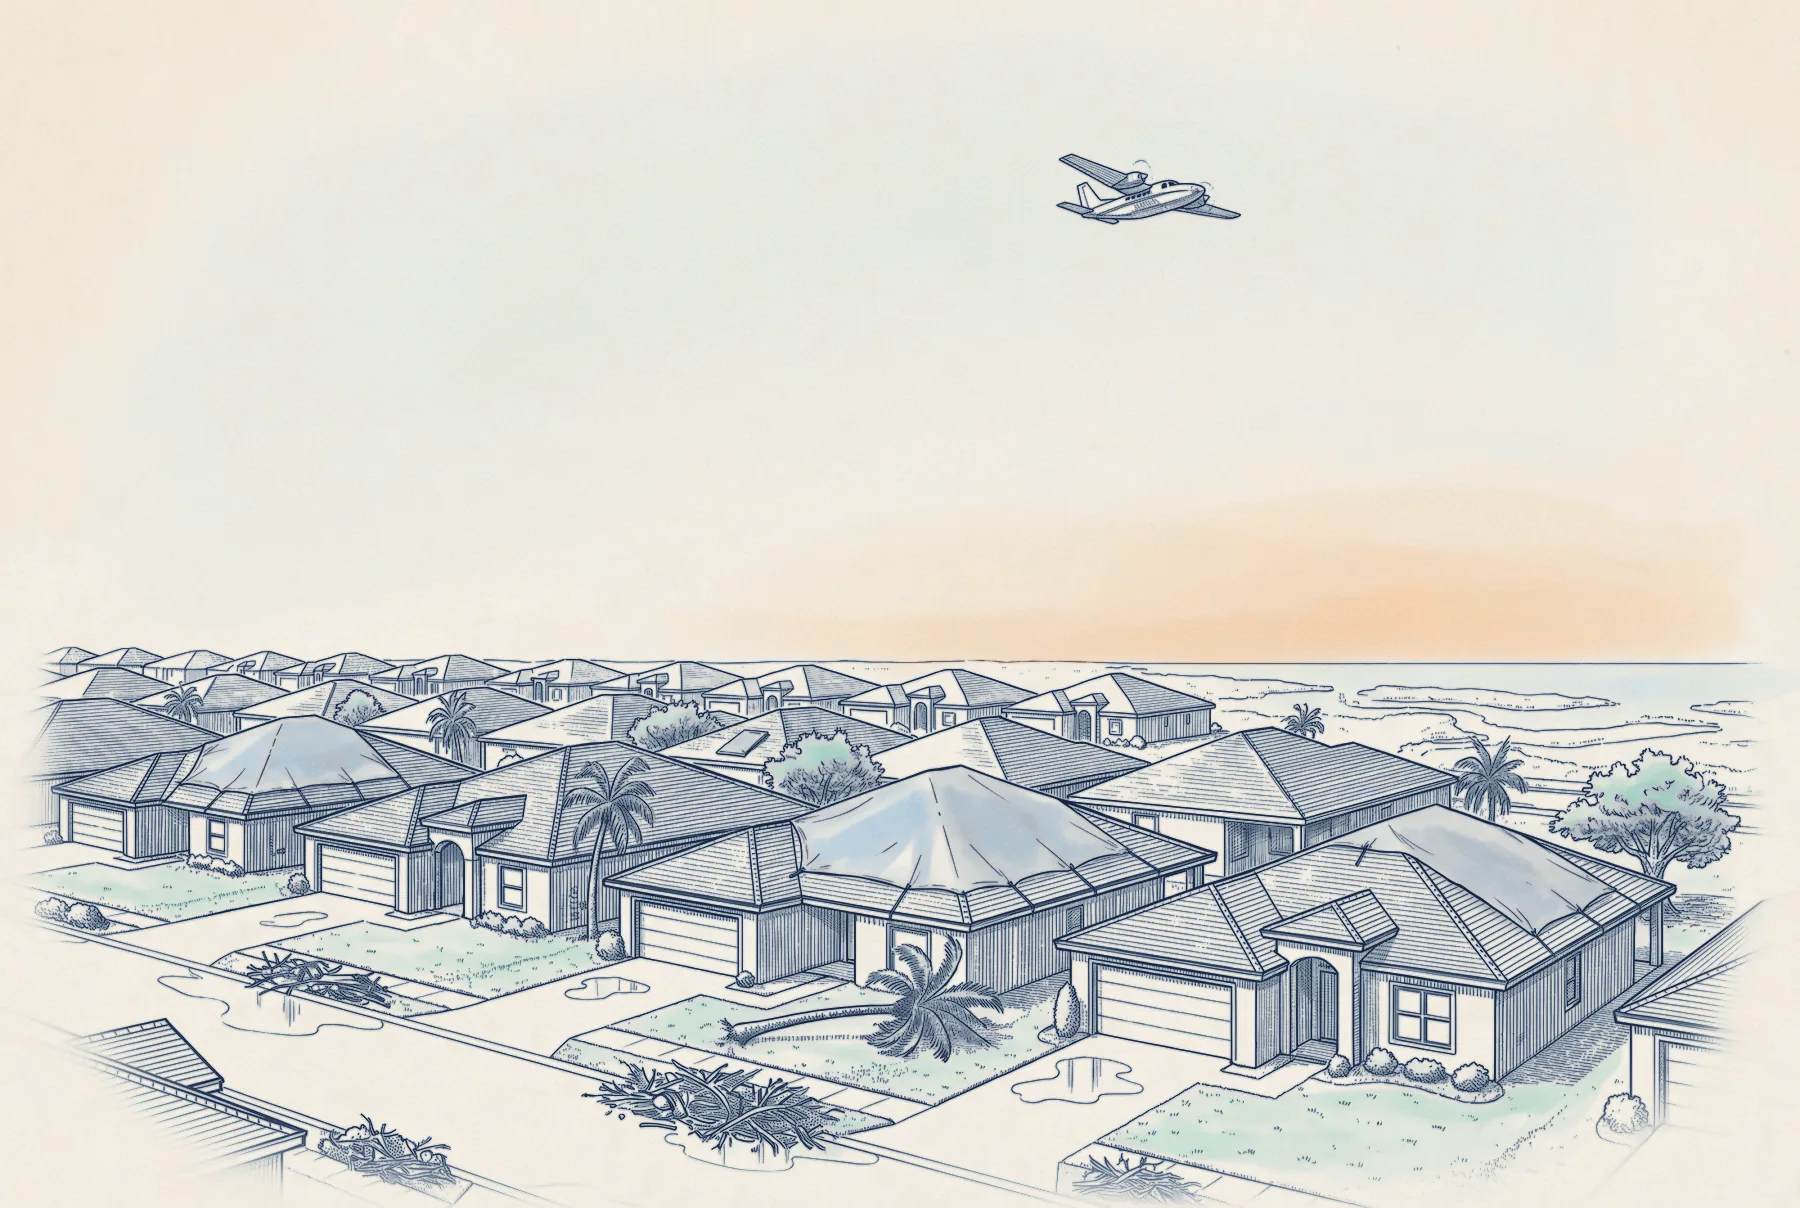
After major landfalls, survey aircraft photograph the coast. We pair those photographs with imagery from before the storm.
We are labeling the damage in these pairs.
Ten pairs from three storms
All ten are on the mainland, away from the barrier islands where surge and wind act together.
Tap or hover for after about 225 m across · north up
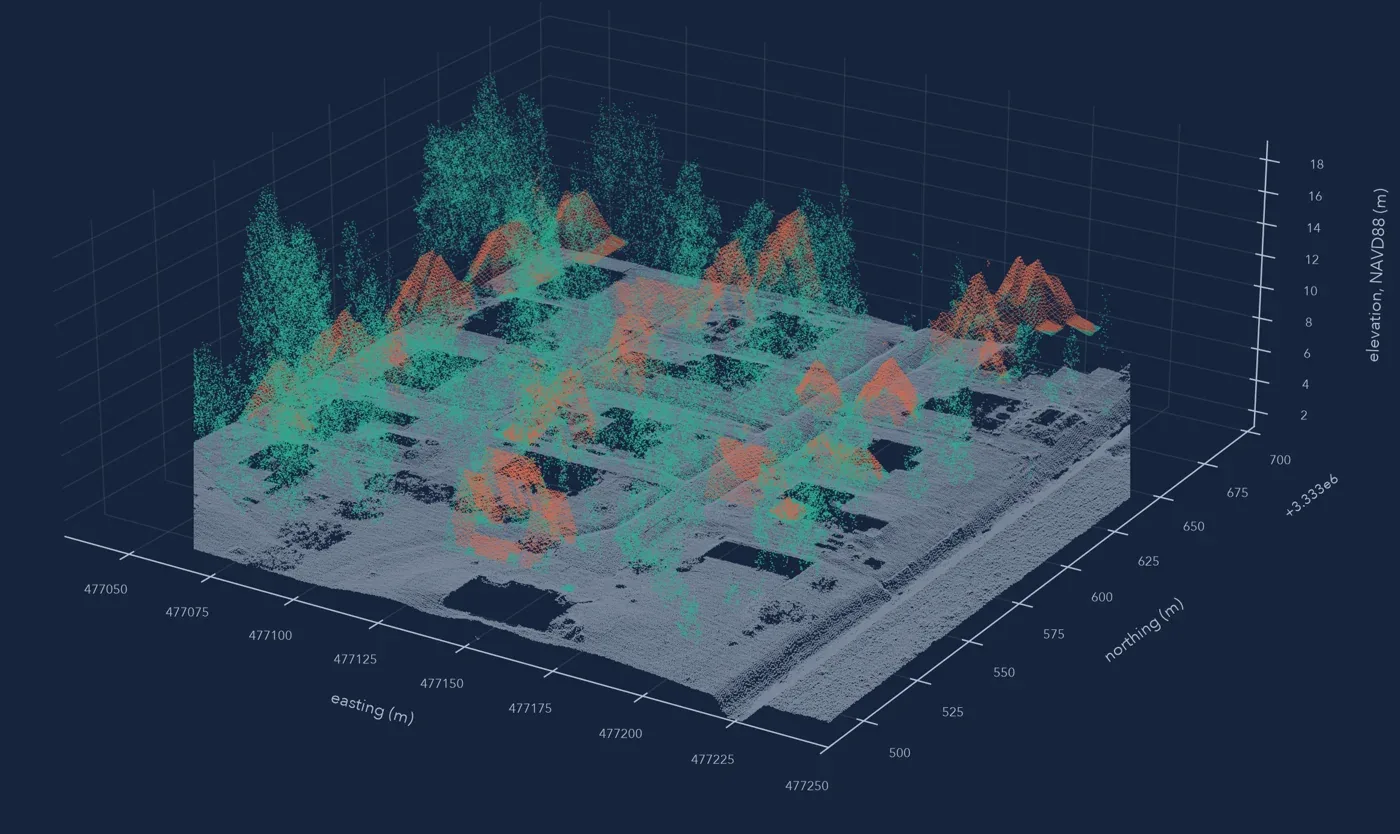
Adding height with lidar
Aerial photographs show roofs. Lidar adds the height of each house, each tree, and the ground around them, which sets the roughness the wind crosses.
How the model learns
We use machine learning conditioned by physics and catastrophe-modeling expertise. We control for what cat models already cover, so the network learns only the local nuance. The aim is a learned stand-in for a fluid-dynamics simulation of each building.
- 1
Start with the property
Identify the building and its characteristics in aerial imagery.
- 2
Look around it
Trees, neighboring buildings, open fetch, and terrain within about 100 m.
- 3
Bring in the wind
Connect the property to the storm’s reconstructed wind field.
- 4
Learn from what happened
Observed damage across past hurricanes, on public data first and customer claims later.
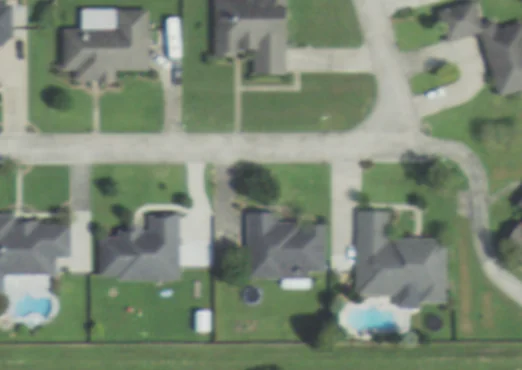
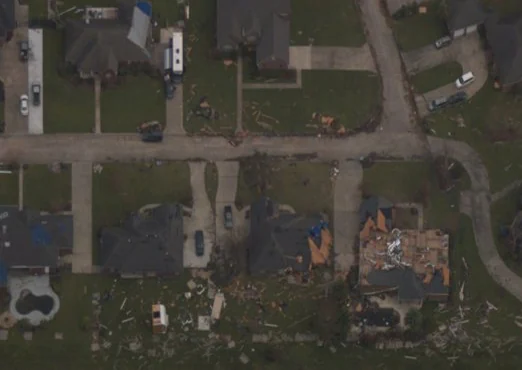
Lake Charles before and after Laura
Lake Charles is about 30 miles from the Gulf, so the damage on this block was from wind. Pairs like this are the training record.
 123
Before · Sep 2019
 123
After · 30 Aug 2020
- 1Shingles gone, and much of the roof deck with them.
- 2The east side lost its cover down to the decking. The west side held.
- 3Two doors west, the roof came through intact.
Two strands of research
We’re studying the details of wind damage to build a physics-informed pipeline.
The wind each building met
We reconstruct each storm’s peak gusts from observations, as in the Isaias footprint and the Ian case study. The next step brings that wind down to each building, through the water, trees, and roofs upwind of it.
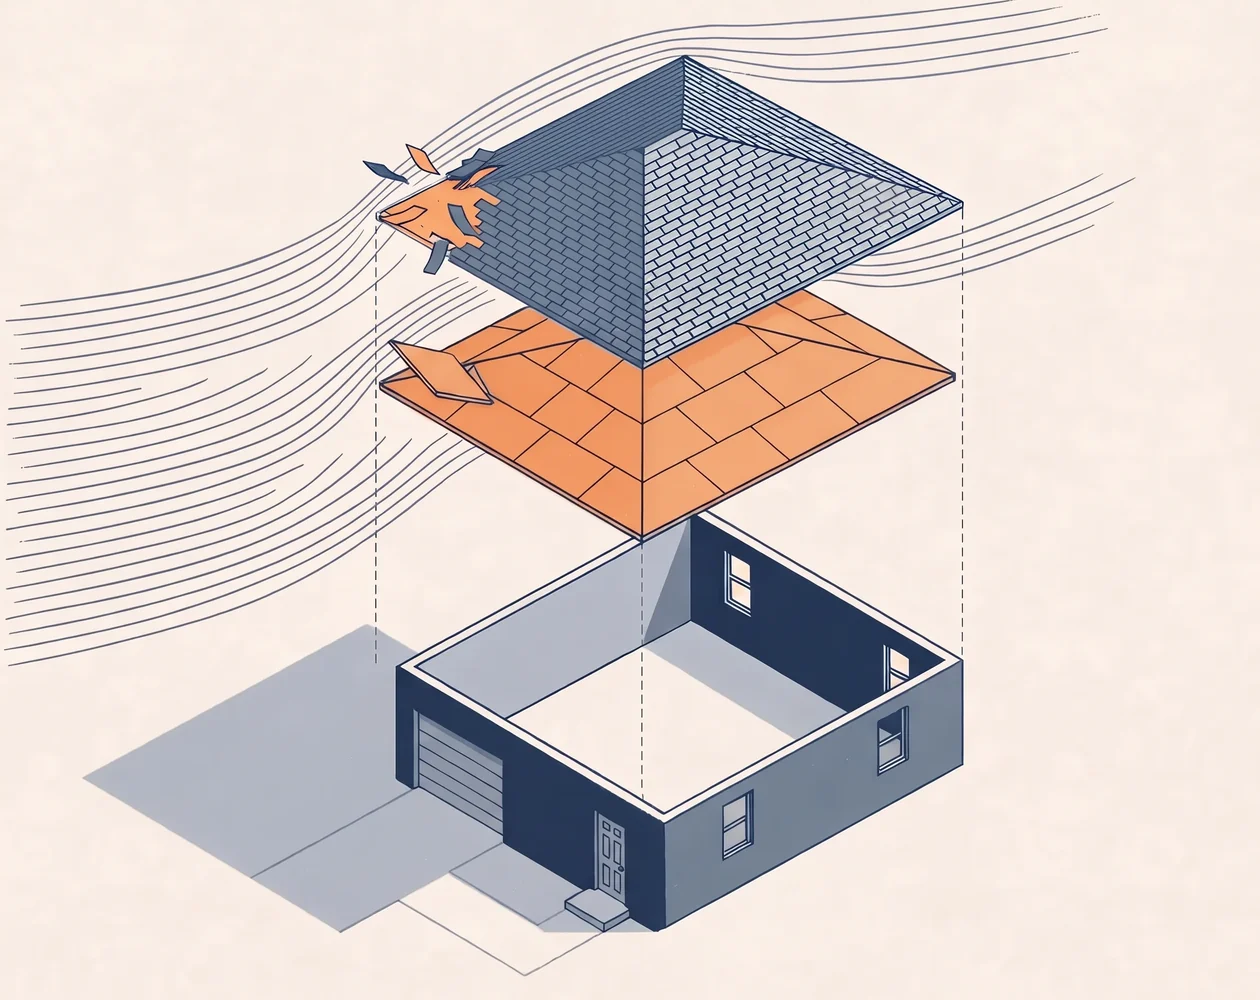
How each part of a house fails
We study how roof cover, deck, openings, and walls fail, in post-storm imagery and public field assessments.
 Illustrative
- W
Wind at the building
- 1
Roof cover
usually the first to go
- 2
Roof deck
once a panel lifts, water gets in
- 3
Openings
a breach lets wind push from inside
- 4
Walls
damage here is structural
The damage model is still in training.
Get in touch
We love feedback. If you’re working through interesting problems in wind risk, let’s chat.
Updates by email
Sign up for monthly updates, new research releases, and live event analysis