
Reconstructing the wind of a whole landfall
A susceptibility modifier depends on an accurate wind field. For Ian we rebuilt the storm’s wind field and scored it against the stations that recorded hurricane-force gusts.
Ian on radar, in our model, and in a parametric model
The Tampa Bay radar tracked Ian’s eyewall from six hours before the Punta Gorda landfall to twelve hours after.
Station error cut from 26 to 16 mph
At the 25 stations that recorded hurricane-force gusts, the mean absolute error of peak gust was 25.6 mph for a standard parametric model and 15.5 mph for ours. The same model runs across a 12-storm historical library.
Where two footprints disagree, a client’s own claims can tell them apart.
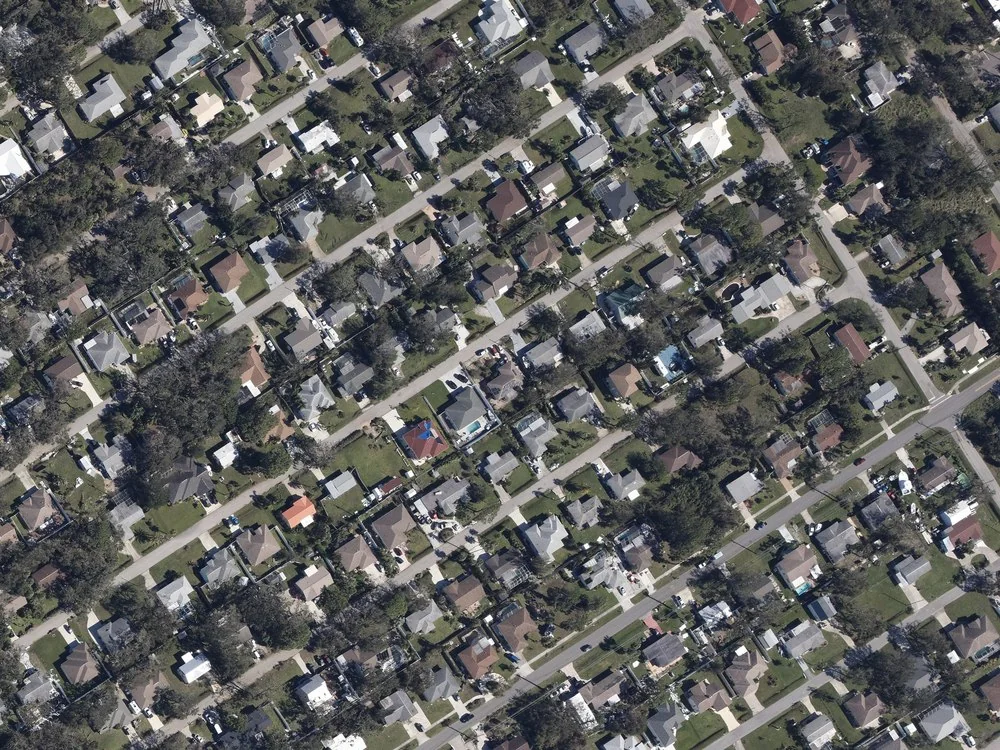
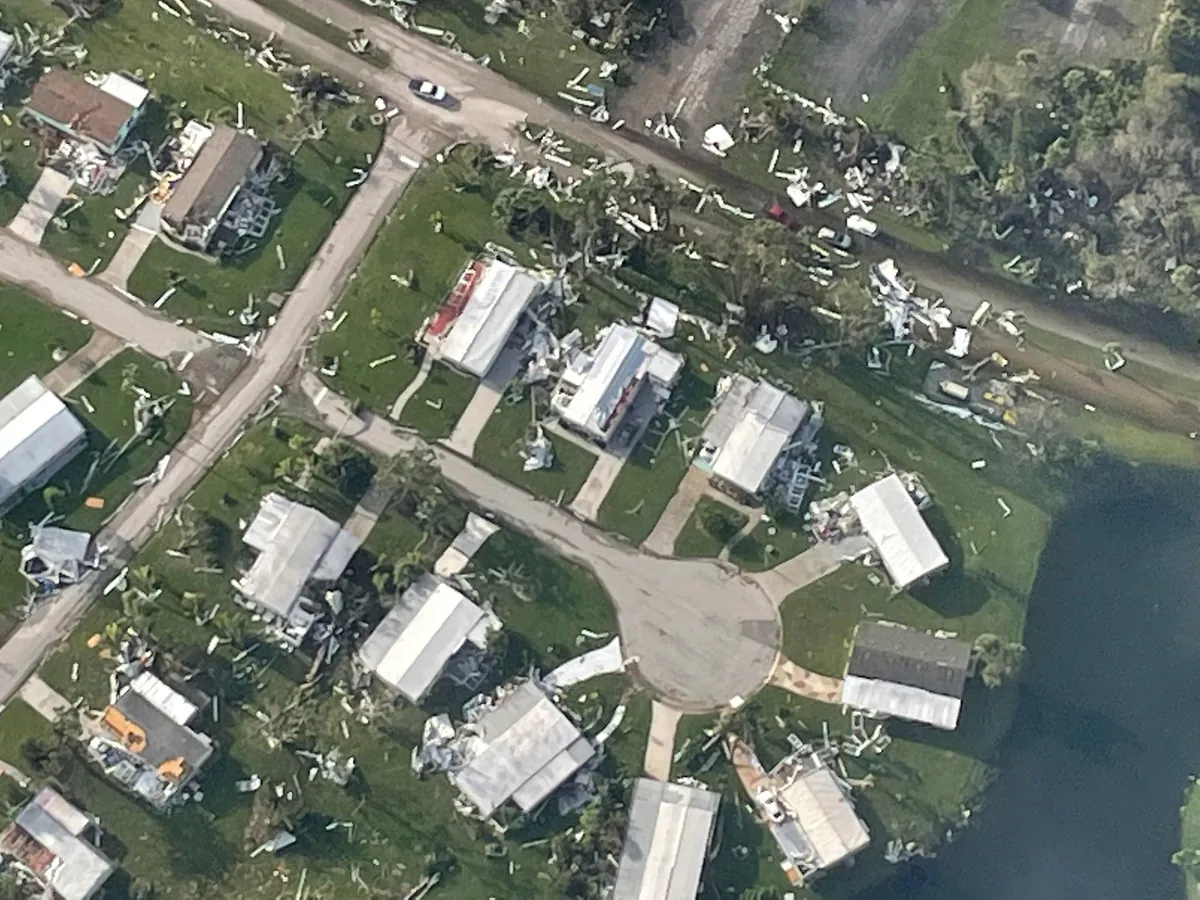
The same properties before and after Ian
For Ian alone we hold before-and-after imagery for 772,603 properties. This is the record a damage model learns from.
Tap or hover for after about 225 m across
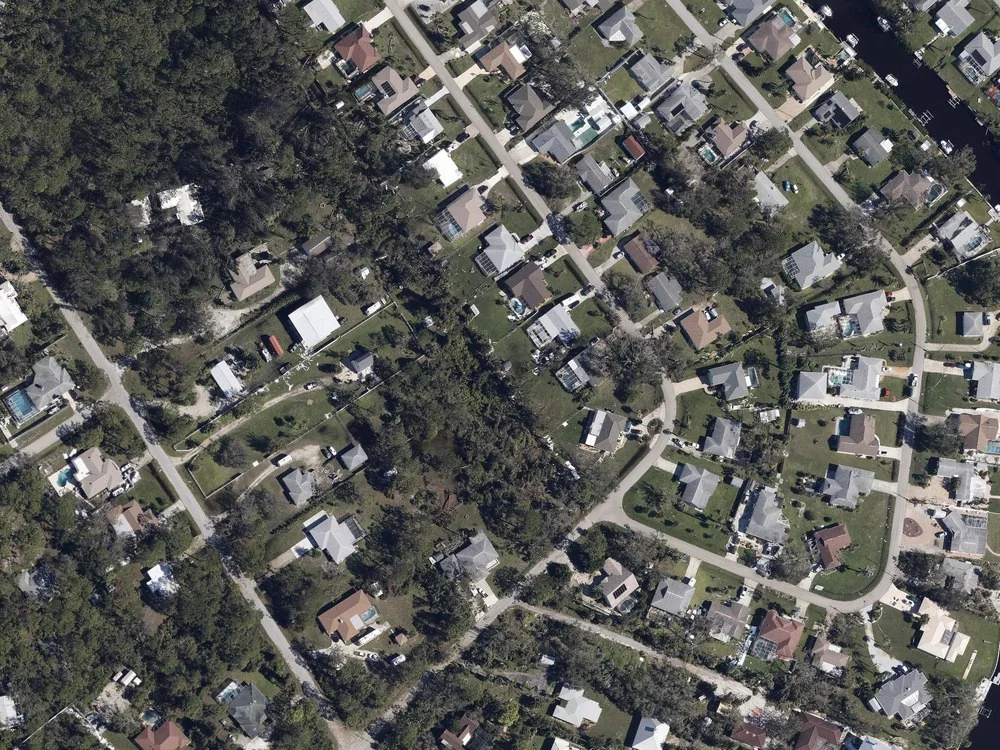
Damage changes from house to house
Along any street the damage is uneven at the scale of single lots, the scale the modifier is built for.
One modifier for each of 33 houses
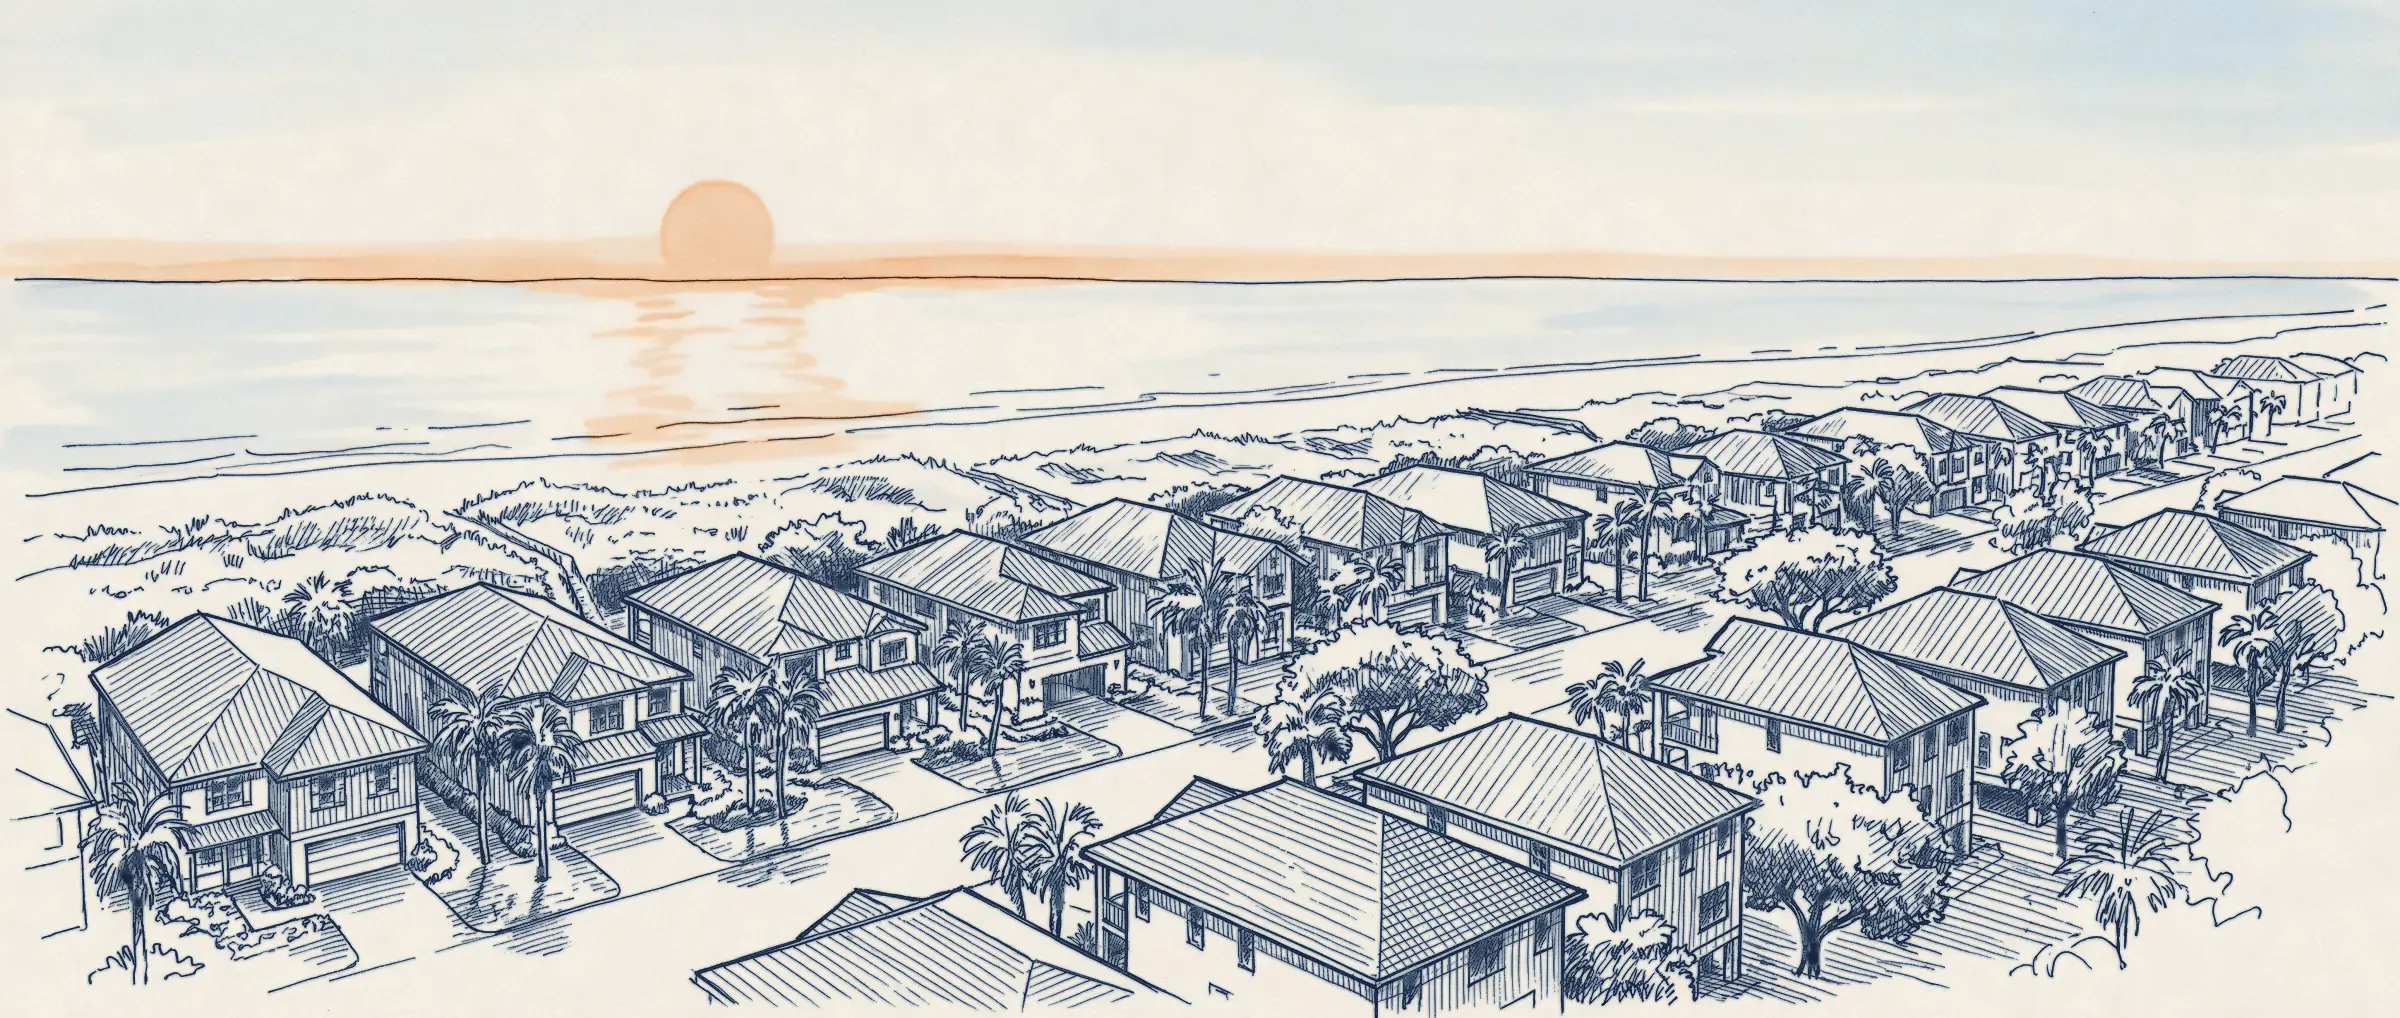
The footprint gives every house on this street close to the same gust. A susceptibility modifier would give each its own number, from what surrounds it.
In this illustration the strongest gusts come from the right, across the canal and the open water beyond it. Homes on the water and at the ends of rows get the highest values. Homes in the lee of other houses and of the tree belt get the lowest. These values are illustrative and are not model output.
Get in touch
We love feedback. If you’re working through interesting problems in wind risk, let’s chat.
Updates by email
Sign up for monthly updates, new research releases, and live event analysis