
Hurricane Isaias: the post-event peak-gust footprint
We published this post-event research footprint within days of landfall. It is free to download and share under CC BY 4.0.
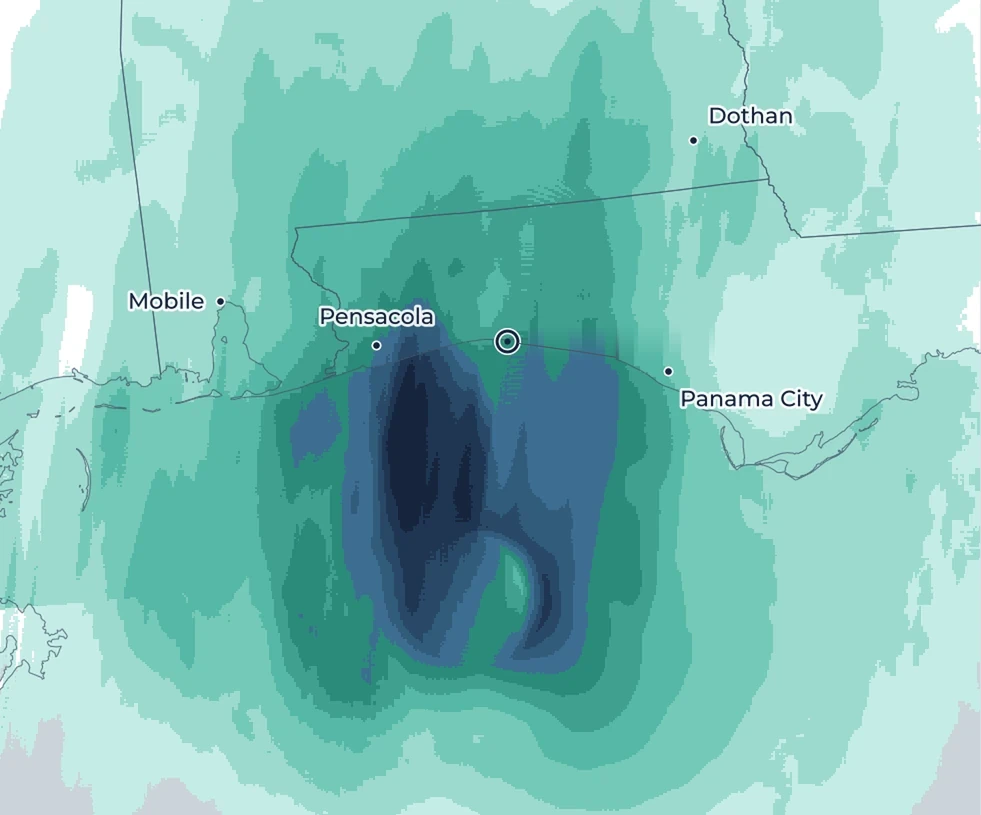 Landfall
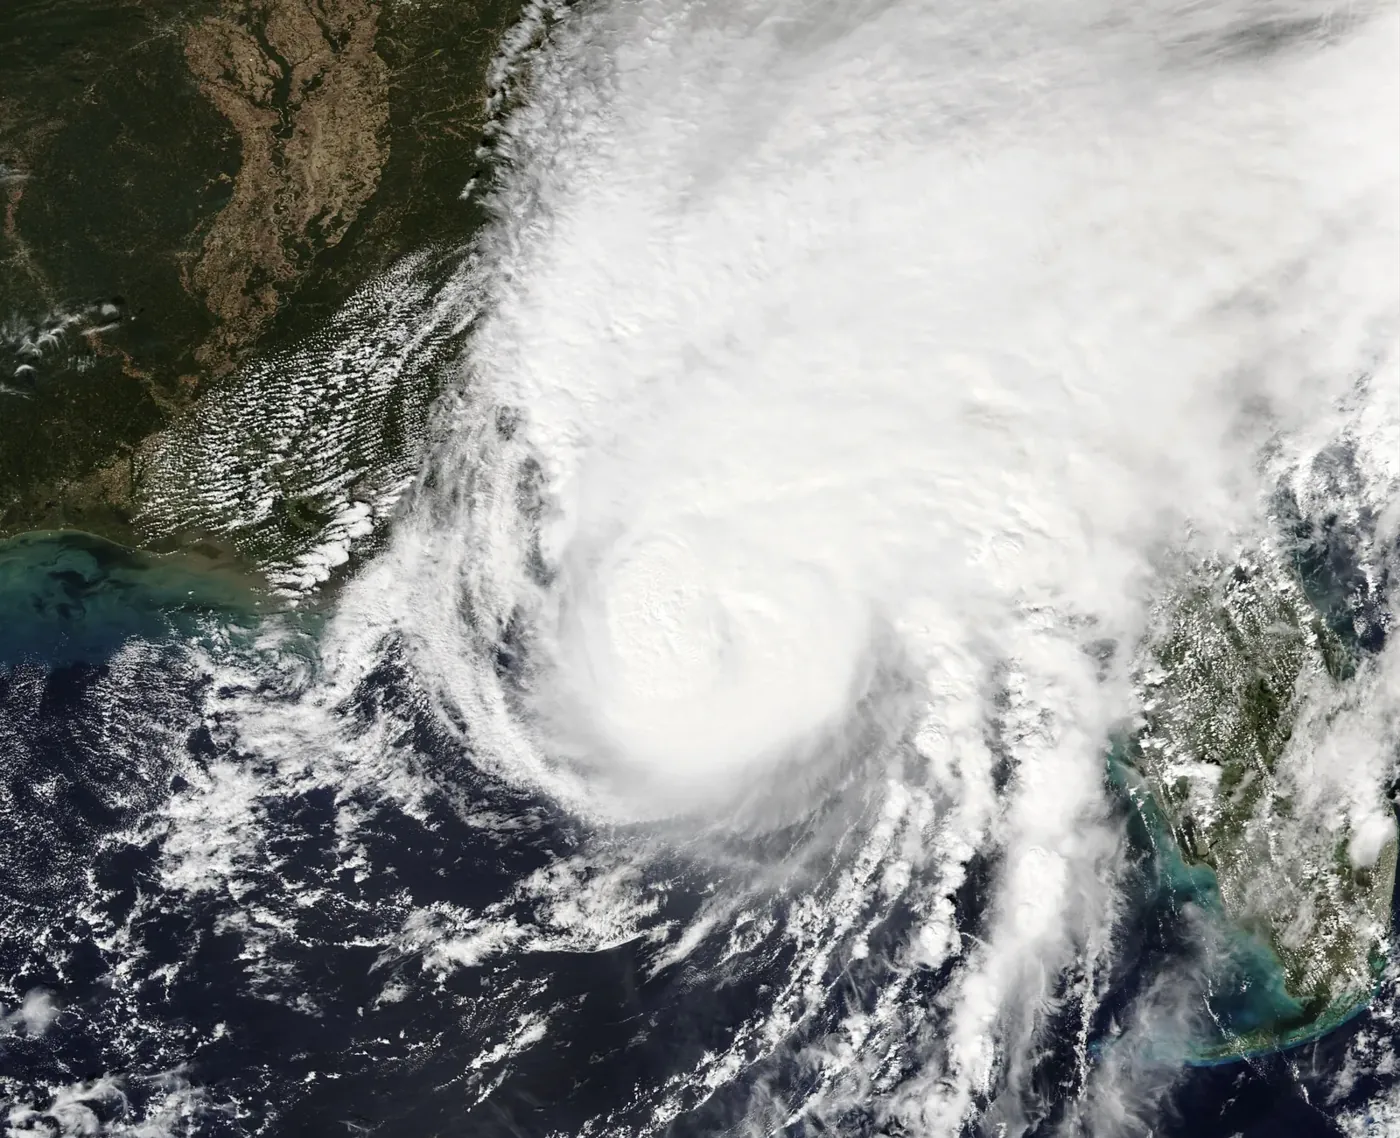
Why the west side was strongest
Isaias was not a textbook hurricane. The strongest gusts, 114–117 mph, were measured around Pensacola, 20–35 miles west of the track. That is normally the weaker side of a storm moving north, so a standard parametric vortex puts the peak winds in the wrong place.
On approach, the National Hurricane Center analyzed 35–45 mph of southwesterly wind shear, and radar showed the storm tilting with height. After landfall, NHC described damaging gusts “in a band wrapping around the western side of the circulation.”1
Aircraft measured 145–157 mph at 8,000–10,000 ft, and dropsondes found a sharp drop-off toward the surface. The west-side band resembles a “sting jet,” in which strong winds aloft appear to have been brought down to the surface in a narrow band as dry air disrupted the circulation.
The side a standard parametric model makes stronger
90th percentile within 12 miles · Sentinel-1 SAR2
How we built the footprint
We used five datasets. Each takes the wind field from the one above and corrects the part it measures best.
- A
NHC best track and a CLE15 vortex
We use NHC’s post-event best track together with the Chavas, Lin, and Emanuel (2015) model of the hurricane wind profile.3
Measures best: track, intensity, sizePasses ona symmetric vortex on NHC’s track
- B
HAFS-A
NOAA’s hurricane model, on a 1.2-mile storm-following grid, gives the shape of the field around the center. Track and intensity stay NHC’s.
Measures best: asymmetryPasses onthe same vortex, made lopsided
- C
Sentinel-1 SAR
A satellite radar image at 6:53 PM CT measured ocean-surface wind on 0.3-mile pixels. Land and areas outside the swath come from HAFS-A, adjusted to match the SAR where both exist.
Measures best: observed wind over waterPasses onobserved over water, filled over land
- D
HRRR
We use NOAA’s HRRR weather model to turn our wind into peak 3-second gusts over land and water.
Measures best: gusts over land and waterPasses onpeak gusts on every 1 km cell
- E
153 stations
Airport, buoy, Texas Tech tower, mesonet, and NWS reports inside NHC’s 34-kt radius. The 22 that failed count as lower bounds, and 81 more outside the radius constrain the outer field.
Measures best: ground truth and scalingResultone scaling on the modeled wind, with the SAR kept as observed
Roof damage rises with the footprint’s gusts
We scored NOAA’s post-storm aerial imagery of 115,687 roofs for likely damage. None of it was used to build the footprint, so it is an independent check.
Under our footprint, the share of roofs likely damaged rises with the gust, to 9% at 120–130 mph. Under a parametric model on the NHC best track, it peaks at 60–80 mph and then falls. Only the wind field differs.
87% of the damaged roofs lie west of landfall, where the footprint puts the strongest gusts.
How the footprint compares with stations
On the coast the footprint captures the west-side band. Inland, in northern Santa Rosa County, it underestimates the band by roughly 20–30%. East of the track it may overstate the contrast.
| Statistic | Value |
|---|---|
| RMSE | 16 mph |
| Within ±25% | 69% |
| Median ratio to observed, 10 stations ≥ 100 mph | 0.94 |
These stations were also used for calibration, so this is an in-sample check of shape.
Land at or above 96 mphmaximum 125 mph
maximum 98 mph
Download the footprint
The link arrives by email after a short sign-up. The footprint is free under CC BY 4.0: you may use it commercially, show it to clients, and combine it with your own event response, as long as you credit Downstream.
Cite as: Downstream Earth Analytics, Hurricane Isaias post-event peak-gust footprint (2026), CC BY 4.0.
If you compare it with a client’s claims, we would like to hear what you find.
A research product, provided as is, without warranty.
Sources
- NHC Hurricane Isaias Discussions 13 (4 PM CT 9 Oct) and 14 (10 PM CT 9 Oct); NHC best track AL092026.
- NOAA/NESDIS/STAR SAR ocean winds, Sentinel-1C, 23:52:56 UTC 9 Oct 2026. Contains modified Copernicus Sentinel data 2026. Statistics computed by Downstream.
- Chavas, D. R., N. Lin and K. Emanuel (2015), A model for the complete radial structure of the tropical cyclone wind field. Part I: Comparison with observed structure, Journal of the Atmospheric Sciences 72, 3647–3662.
Data: NOAA HAFS-A and HRRR forecasts, NOAA Open Data Dissemination; Iowa Environmental Mesonet ASOS archive; NDBC; Texas Tech University StickNet; NWS Local Storm Reports and the NWS Mobile/Pensacola Public Information Statement (3:37 AM CT 10 Oct). Station statistics cover all 107 working stations at or above 40 mph inside NHC’s 34-kt radius. All figures are from Downstream’s technical memo of 2026-10-11.
Get in touch
We love feedback. If you’re working through interesting problems in wind risk, let’s chat.
Updates by email
Sign up for monthly updates, new research releases, and live event analysis