Physics: Why nearby houses experience different winds

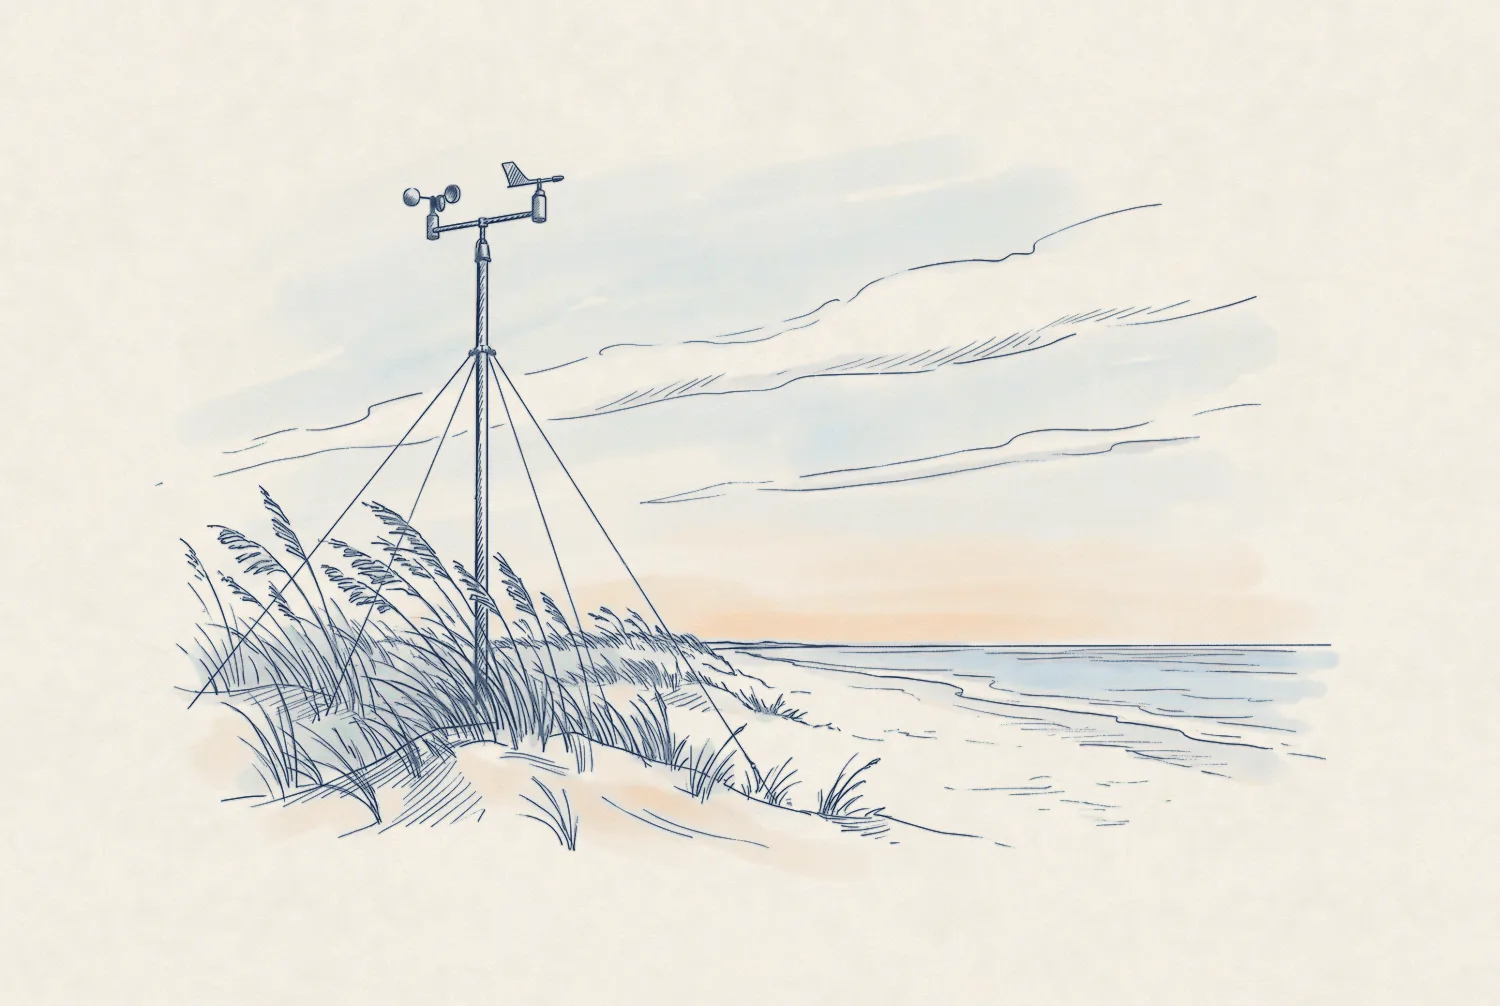
Pen-and-ink drawing of a weather station mast with a cup anemometer and a wind vane on a dune, sea oats bending in a wind from the left.

Interactive: A toy model of hyperlocal risk

Every house in this sketch sits in the same 1 km cell, modeled at 104 mph. What changes the gust at one house is what the wind crossed just before reaching it: open water, rows of roofs, or trees. Drag, move, and shield the house to see how its gust changes. The toy is a simple sketch and does not use our model.

Scene
Tool
Illustrative

Downstream winds are channeled by upstream features

Behind the first roofs, the wind near the ground becomes slower and more turbulent.

Cross-section of the block from the water inland, wind from the left. The wind profile is full almost to the ground over water and at house A. Inland, an internal boundary layer grows from the first roofs, and house B sits inside it and the roughness sublayer. Vertical scale exaggerated. A B INTERNAL BOUNDARY LAYER grows downwind from the first roofs LEE EDDIES ROUGHNESS SUBLAYER roofs to 2–5× their height OVER OPEN WATER ARRIVING AT A ARRIVING AT B Vertical scale exaggerated WIND, THIS EXAMPLE → Gulf beach dune

Support and evidence from the engineering literature

+50%

Open terrain raises design pressure

Design pressure is the wind load a building code requires a house to withstand. ASCE 7‑22 sets it about 50% higher for the same house in open terrain than in a suburb.1
−50%

Tree effects depend on wind angle

Upwind trees can cut peak roof suction by up to half, and raise it at other wind angles.2

+200%

The increase in roof damage seen on exposed hilltops

From a Cyclone Yasi survey covering 1,371 homes3

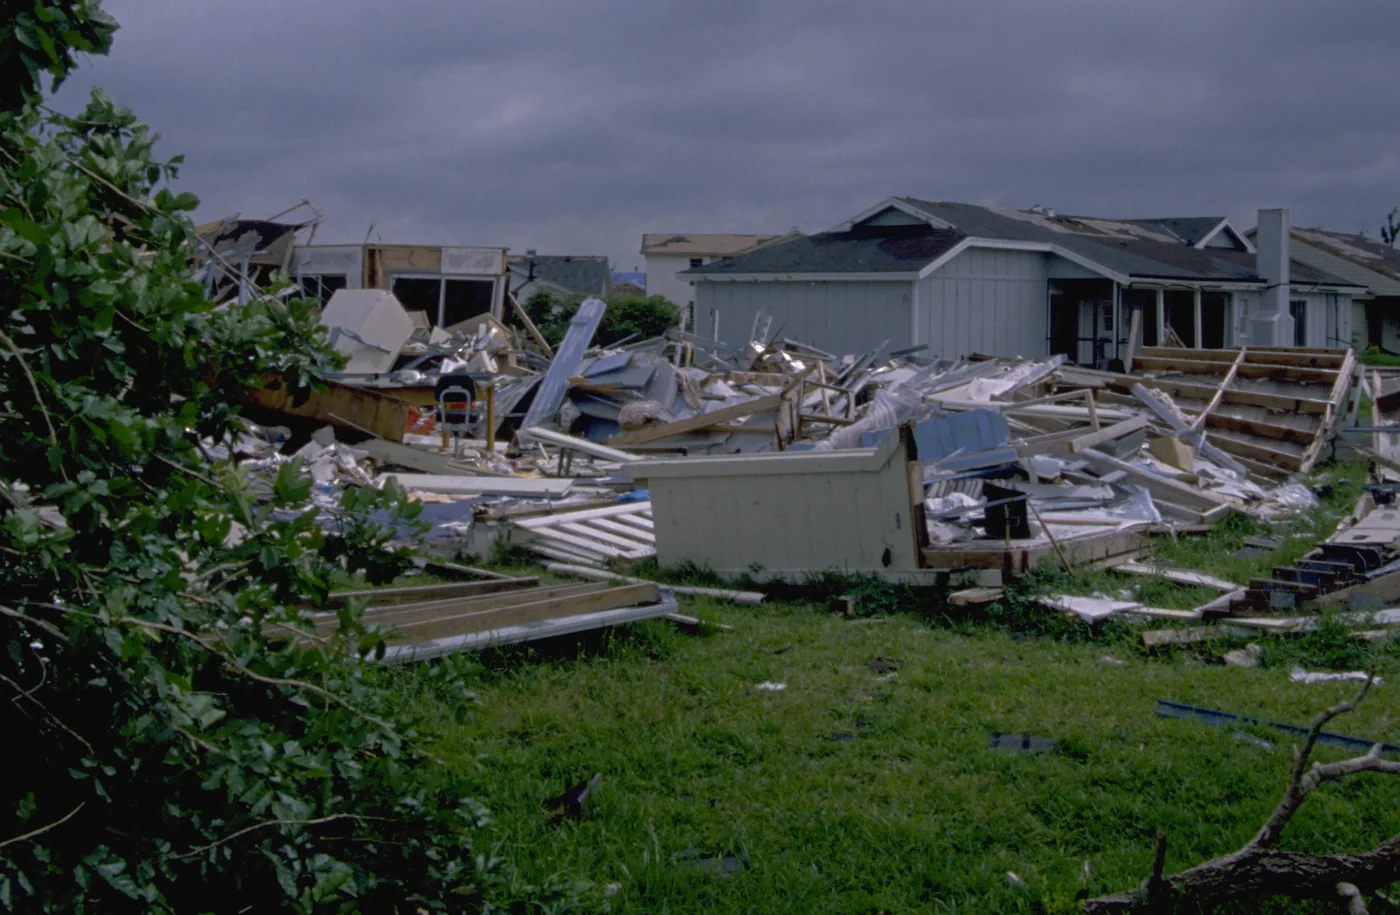
These effects were observed after Hurricane Andrew

“Structures exposed to flow over open terrain were much more susceptible to damage than those sheltered by surrounding houses or trees upwind.”

Powell, Houston, and Reinhold, 1996, on Hurricane Andrew.
Why this is possible now →

Photograph of a Dade County street after Hurricane Andrew: a house reduced to a pile of debris, with neighboring houses standing behind it, roofs largely intact.
Dade County, Florida, 24 August 1992.

Sources

  1. ASCE 7‑22, Table 26.10-1: velocity pressure exposure coefficient at 15 ft, open terrain (Exposure C) 0.85, suburban (Exposure B) 0.57.
  2. Ibrahim et al. 2025, J. Wind Eng. Ind. Aerodyn. 265:106179.
  3. James Cook University Cyclone Testing Station, 2011, TR57: exposed hilltop sites 9%, ordinary sites 3%.
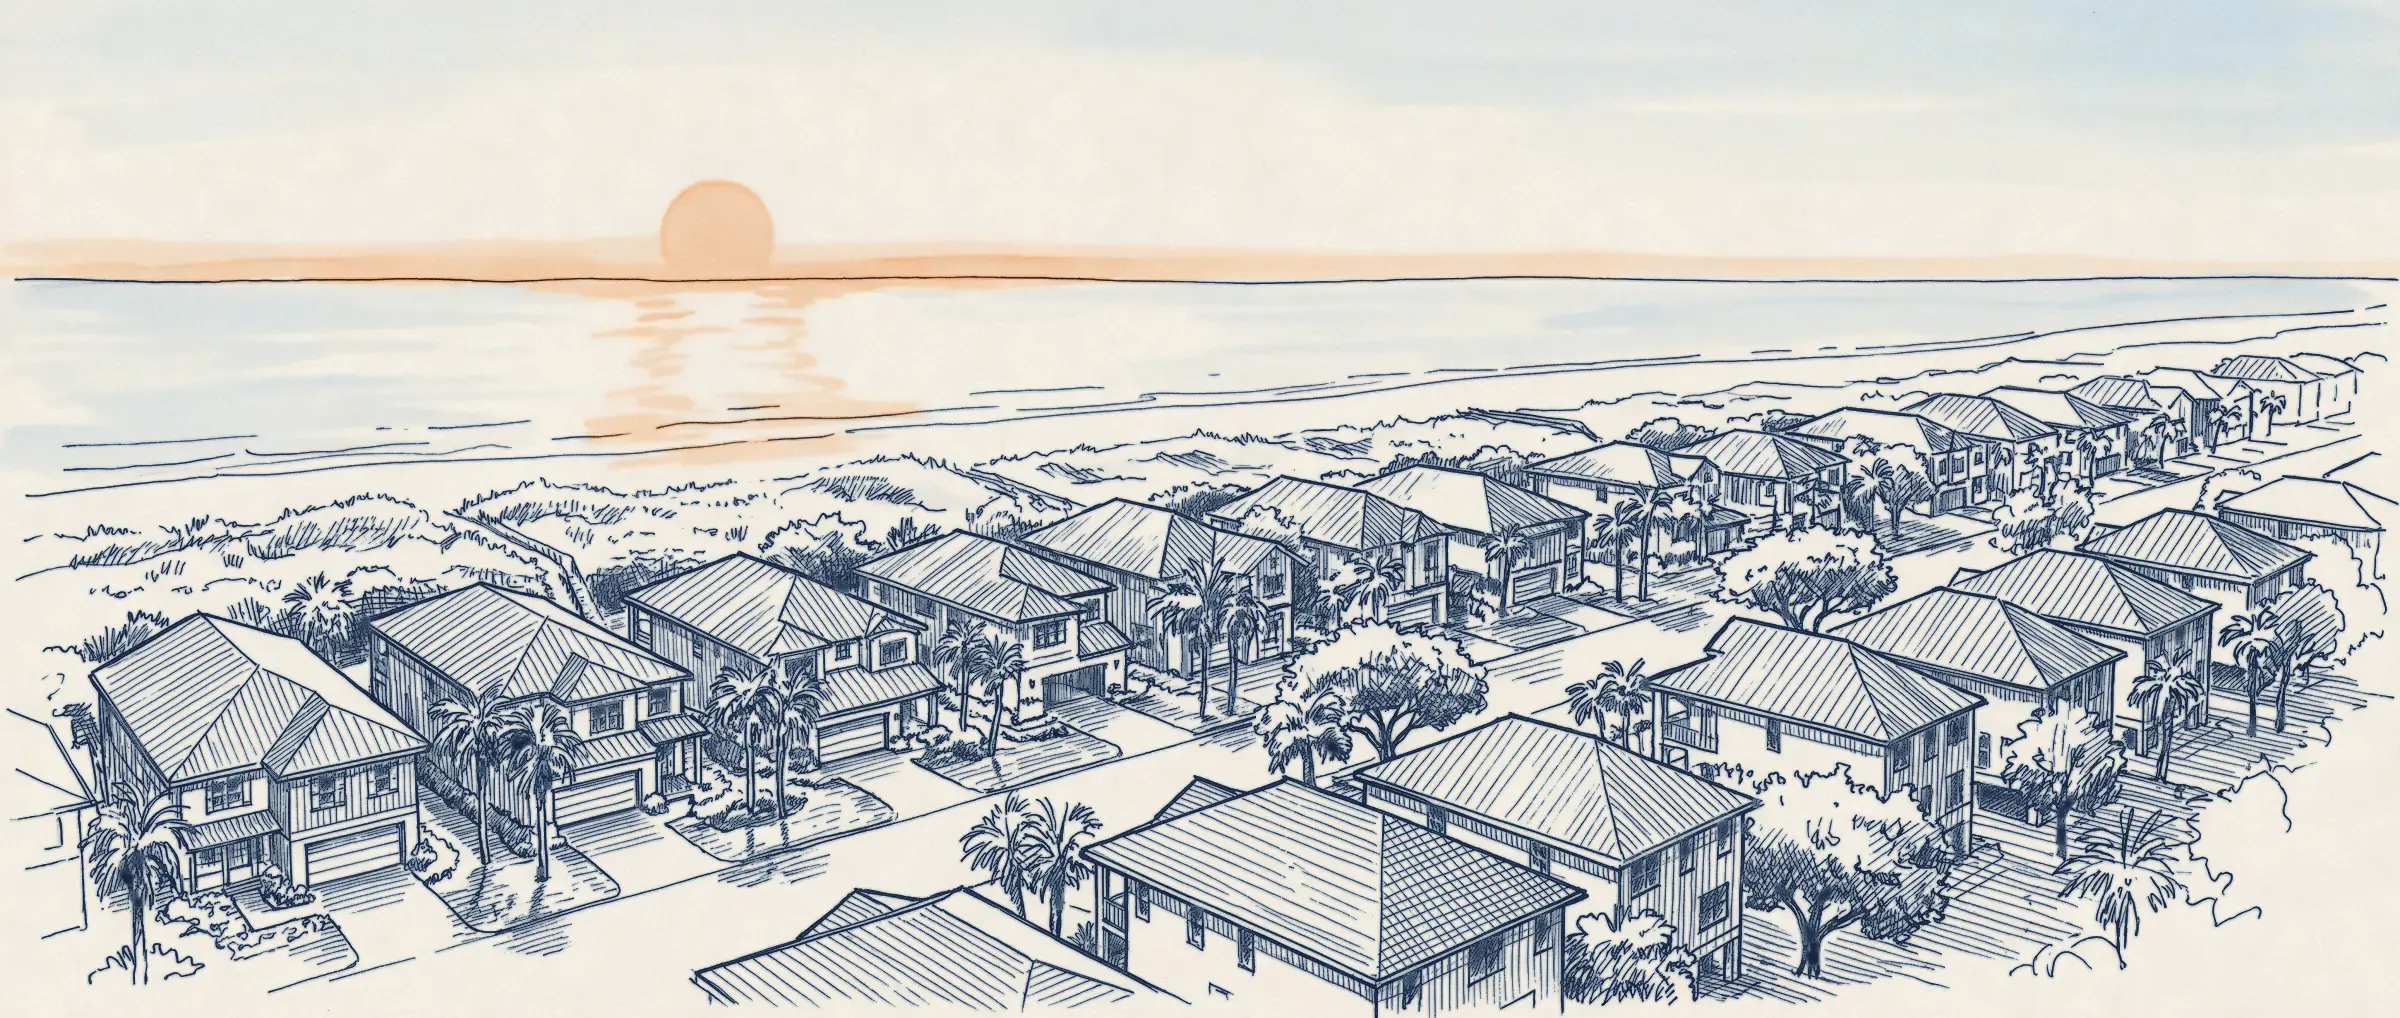
Pen sketch of a shore neighborhood at sunrise, hip-roofed houses and palms above a beach.

Get in touch

We love feedback. If you’re working through interesting problems in wind risk, let’s chat.

ted@downstream.earth
marketing@downstream.earth

Updates by email

Sign up for monthly updates, new research releases, and live event analysis